
Underground Damage Prevention Statistics
Various Charts showing Historical Amount of Notifications, Historical Amount of Damages for all types, Historical Amounts of Civil Penalties per 6 month period, Historical Amounts of Civil Penalties per Biennium, Historical Gas Damages Per 1000 Notification Metric, Historical Non Gas Damages Per 1000 Notification Metric, Break Down of Gas Damages By NH Gas Operators, Break Down of Annual Notifications By NH Gas Operators, Break Down of Gas Damages per 1000 Notification per Operator Metric, Peer Group Statistics, Number of Gas and Non Gas cases disposed including findings, civil penalties, trainings conducted and cases dismissed for the One Call Grant Year 2020.
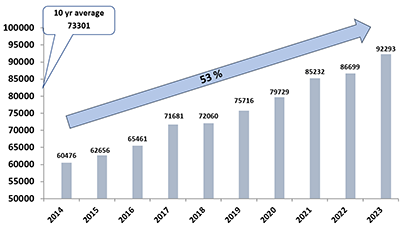
Calls to Dig Safe Systems, Inc. for New Hampshire Locates - Dig Safe Annual Report
10-year chart of New Hampshire Notifications showing increase of 60% from 2014 to 2023 (ranging from 60,476 tickets in 2014 to 92,293 tickets in 2023).
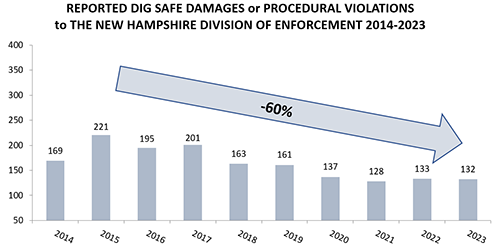
Reported Dig Safe Damages or Procedural Violations to the New Hampshire Department of Energy Division of Enforcement
10-year chart of New Hampshire Damages or Potential Violations showing decrease of 60% from 2015 to 2023 ranging from 221 Damages per year in 2015 to 132 damages per year in 2023.
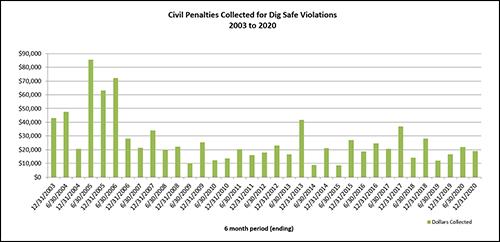
Civil Penalties Collected for Dig Safe Violations
Civil Penalties collected per 6 month period during 2003 to 2020 ranging from $8,500 to $85,400 per 6 month period
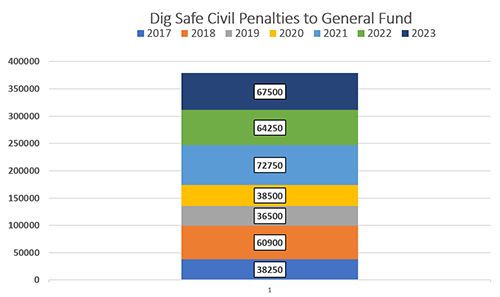
Dig Safe Civil Penalties to the General Fund
Civil Penalties collected per Annum range from $36,500 to $72,750 and all are applied to New Hampshire General Fund
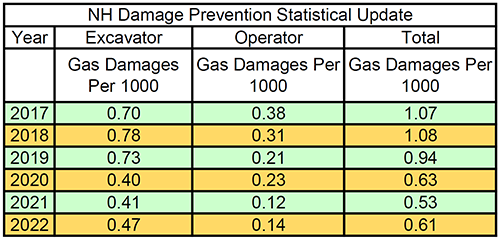
New Hampshire Gas Damage Prevention Statistical Update
New Hampshire has Historical Gas Damages that typically range from 0.53 damages per 1,000 tickets to 1.08 damages per 1,000 tickets for the period 2017 to 2022.
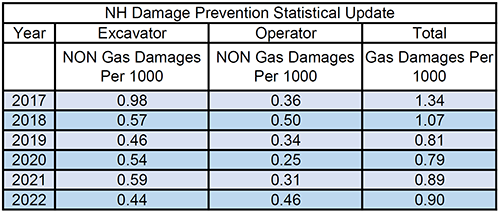
New Hampshire Non-Gas Damage Prevention Statistical Update
New Hampshire has Historical Non-Gas Damages that typically range from 0.79 damages per 1,000 tickets to 1.34 damages per 1,000 tickets for the period 2017 to 2022.
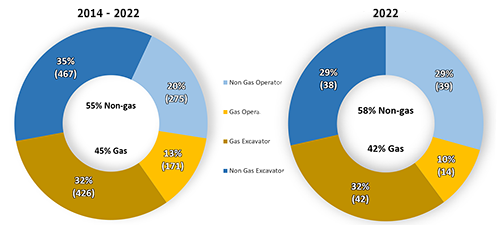
New Hampshire Dig Safe Violations for Gas and Non-Gas Excavators and Operators
Historical data from 2014-2022 Of Excavator and Operator violations. Excavators generated 67%of the violations and Operators generated 33% of the violations. Additionally, in 2022 there were a total of 133 violations. Excavators has 61% and Operators had 39% of all violations.
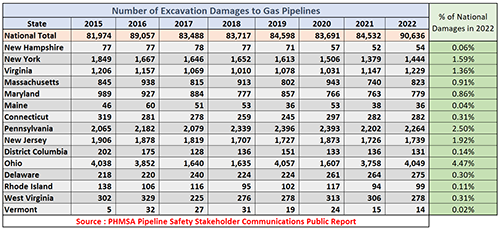
Eastern Region Excavation Damages to Gas Pipeline
New Hampshire excavation damages to pipelines compared to National Totals and Eastern Region States in tabular format for the period of 2015 to 2022. Includes breakdown of what percentage that state contributed to the National Total.
Source: PHMSA Pipeline Safety Stakeholder Communications Public report.
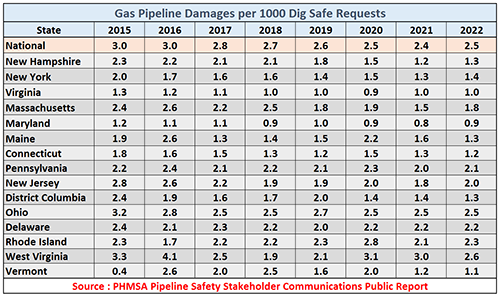
Eastern Region Gas Pipeline Damages per 1000 Dig Safe Requests
New Hampshire damage prevention statistics compared to National and Eastern Region States in tabular format for the period 2015 to 2022.
Source: PHEMSA Pipeline Safety Stakeholder Communications Public Report.
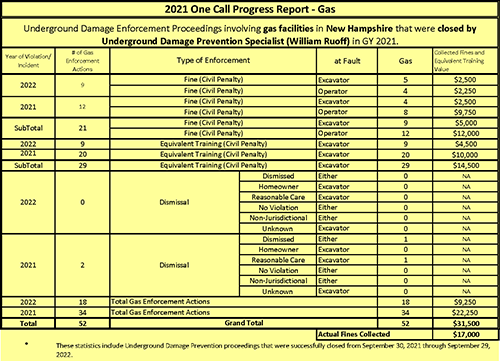
One Call Progress Report - Gas Proceedings
2021 and 2022 case findings for Gas Damages showing who was at fault and associated civil penalties or trainings provided.
52 cases were closed with trainings and civil penalties applied equivalent to $31,500.
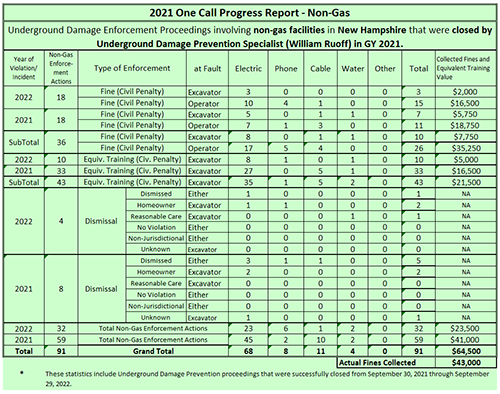
One Call Progress Report - Non-Gas Proceedings
2022 and 2021 case findings for NON Gas Damages showing who was at fault and associated civil penalties or trainings provided. 91 cases were closed with trainings and civil penalties applied equivalent to $64,500.